Data Visualisation for Analysing and Communicating Effectively
Willis Towers Watson is a leading global professional company that helps clients turn risk into an opportunity for growth. With over 45,000 employees, the company serves more than 140 countries and markets, providing innovative solutions for sustainable futures.
The company approached Brightec to assist with creating a design to communicate the information effectively. The resulting product allows a large quantity of data to be displayed in an effective and highly presentable way.
Using Visualisation to Make Complex Data Accessible
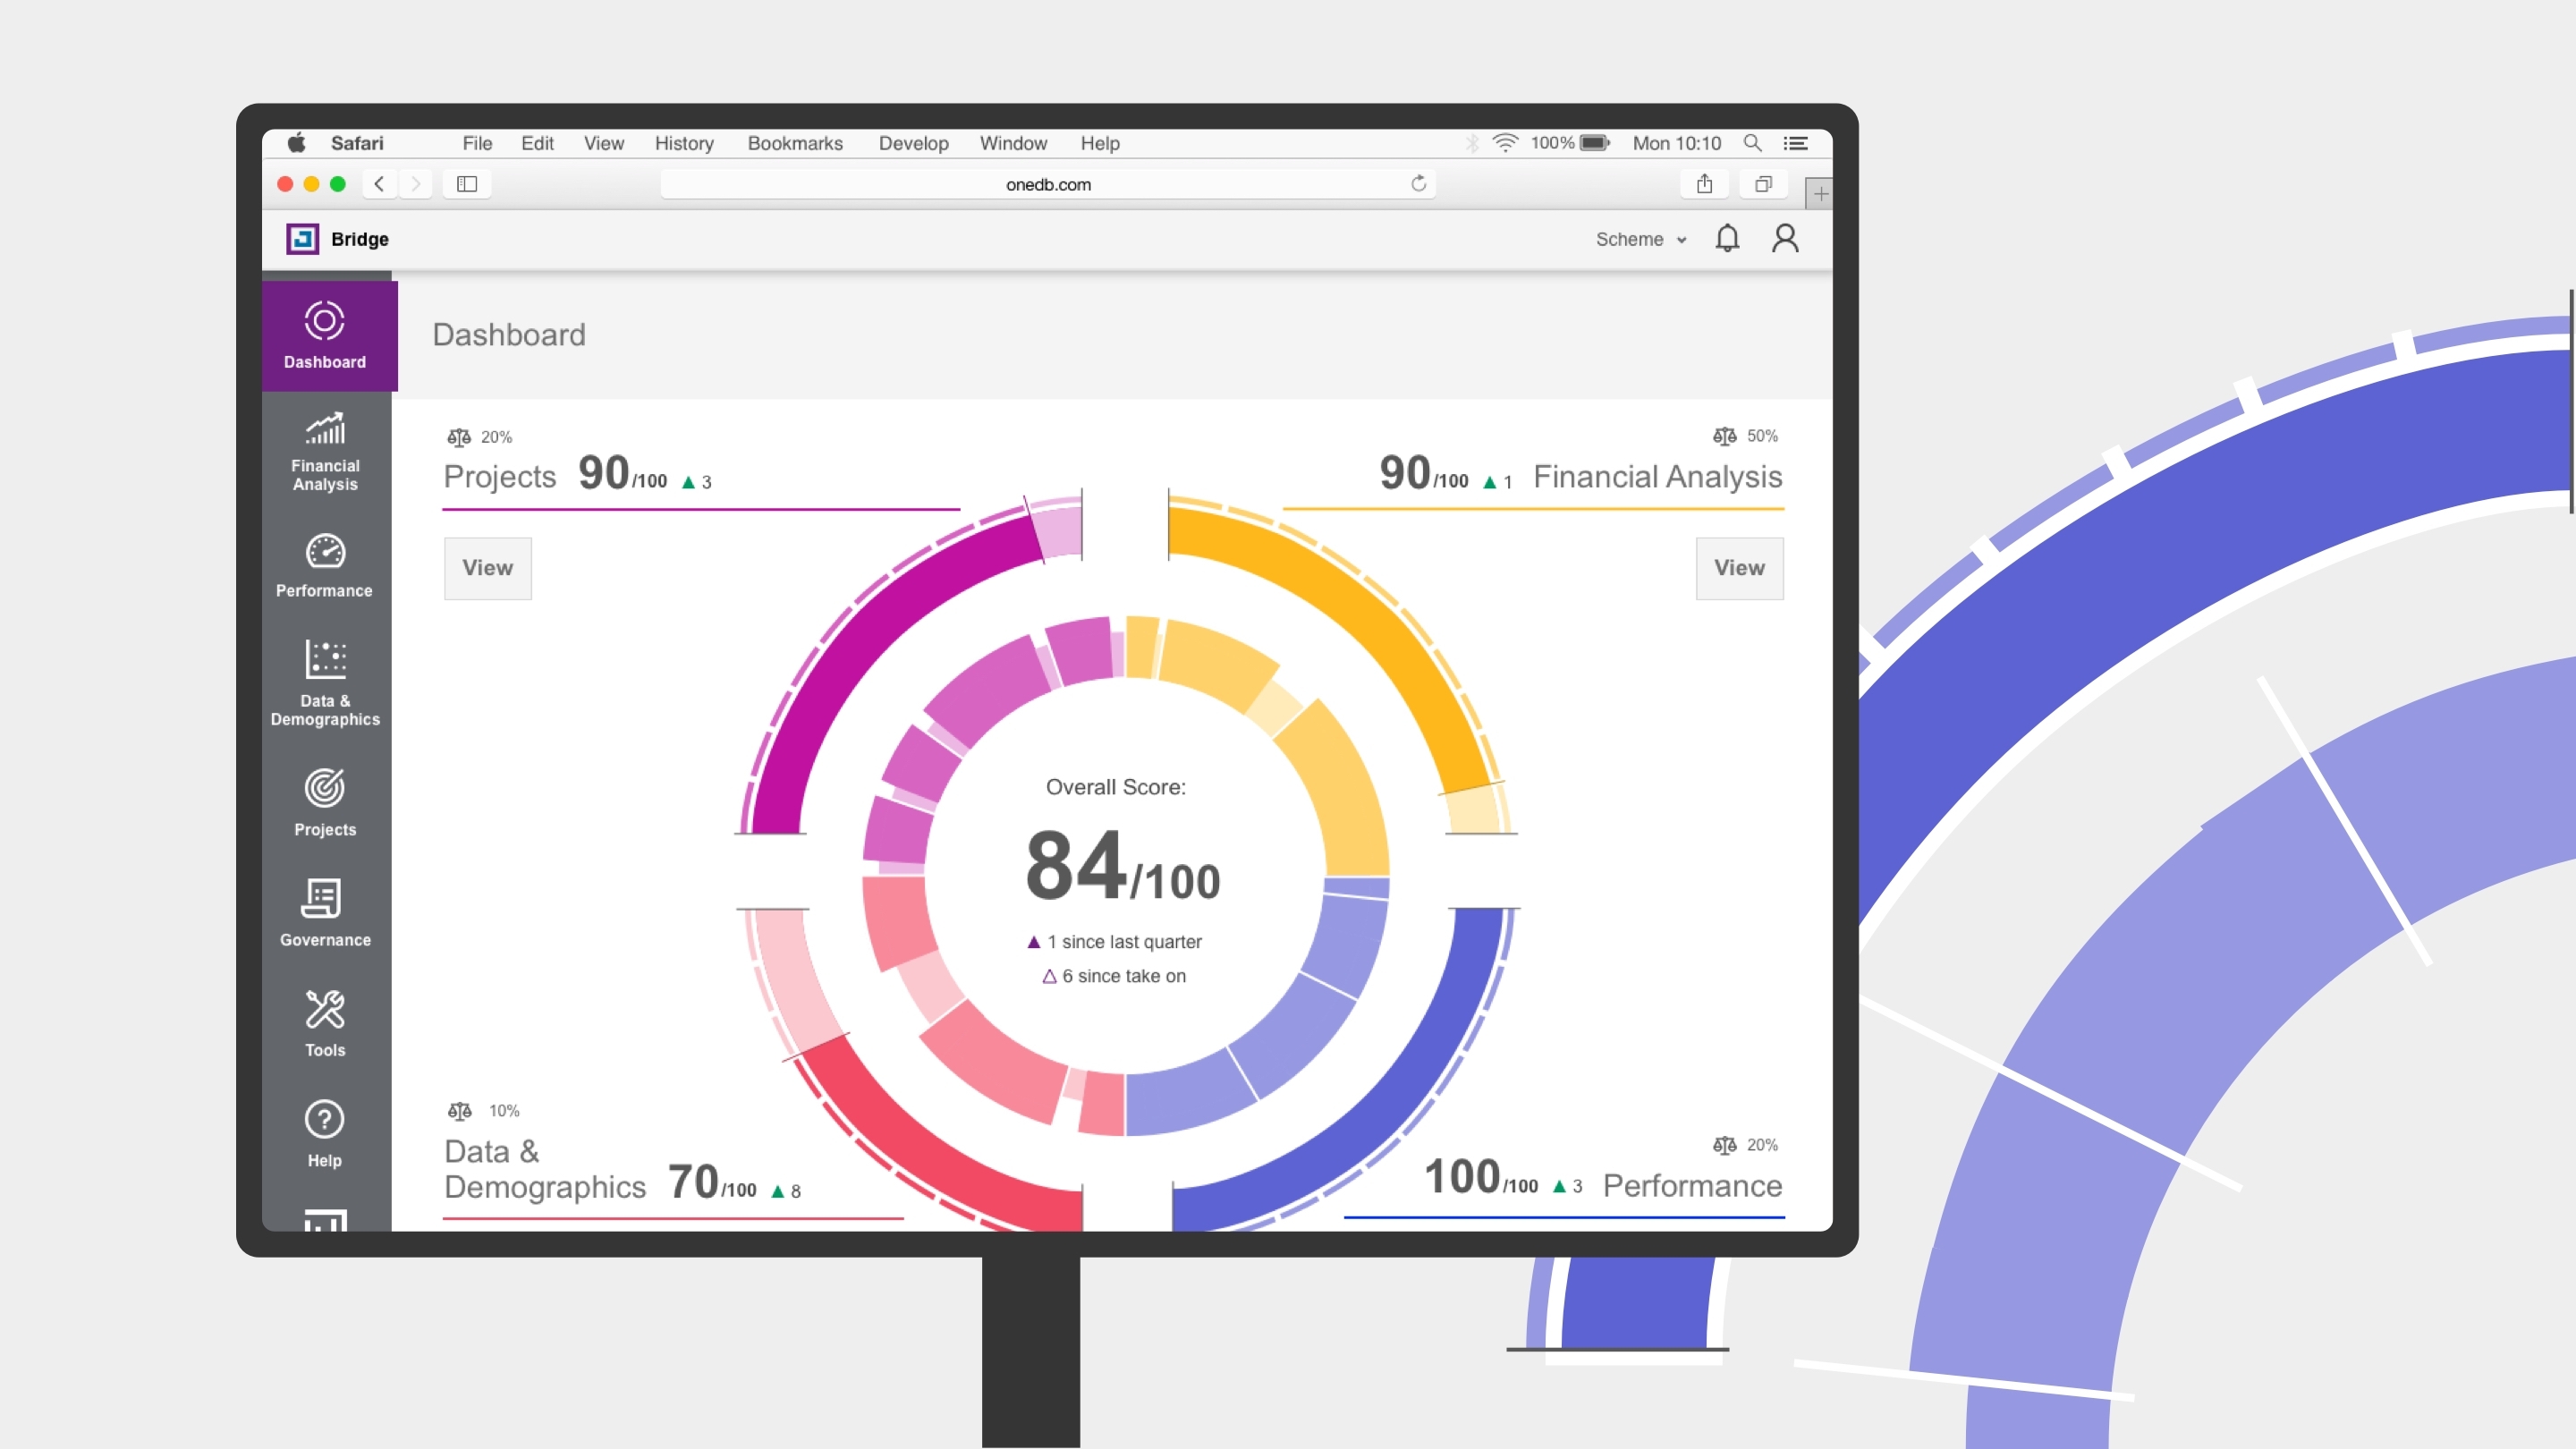
Our remit was to work with the Willis Towers Watson team to design and produce a presentational layer that could be merged directly into a larger piece of product architecture which would showcase all the data for each OneDB client in a visual format. The product would have a dashboard for clients with personalised data tailored to their needs.
At the start of the project, we met with Willis Towers Watson to discuss their ideas and look at some of their designs. From the very beginning, they wanted the dashboard to be displayed in a circle with animated parts. However, some of their initial designs were not so easy to understand from a UX point of view, so working closely with our design team we were able to discuss the best options for moving forward. Through our collaborative efforts, we managed to culminate their designs with those from our team into one that worked brilliantly.
Data Visualisation Software and Security
One of the main challenges we faced while working on this project was just how tight the security needed to be. As Willis Towers Watson is a financial company, the project had to fall under certain data security restrictions. Throughout, we were limited on the use of external data software we would normally use to develop apps. This was a challenge initially as we did not have all the app development tools available to us. So, some aspects of the project took longer than usual.
For security reasons, Willis Towers Watson would send us data files to create the visuals from. Once our design team had created the visuals, we sent these files back to be integrated with the Willis Towers Watson’s live data we were not granted access to. Because we were working on different networks, it was difficult to move files easily between our companies, so we wrote scripts that helped migrate the programmes from our networks onto their site.
Although these challenges were tricky to navigate at first, they helped us create innovative solutions to our problems. This project really brought us closer together as a team.
Data Visualisation: The Art and the Science
Great data visualisation has always been extremely important to us. Our design team at Brightec have a strong user focus, so they are always intent on designing intuitive solutions and thinking about app development from the user’s perspective.
“Good data visualisations should place meaning into complicated datasets so that their message is clear and concise.” – Search Engine Journal
Jotham, our designer on the project really spearheaded the way on the visual development of this tool. Having worked with Willis Towers Watson for many years, he quickly understood the design they were aiming for and he understood the kind of visuals they were hoping to achieve. Jotham ensured we displayed all the data in a way that beautifully matched the design, so that the message was clear and concise.
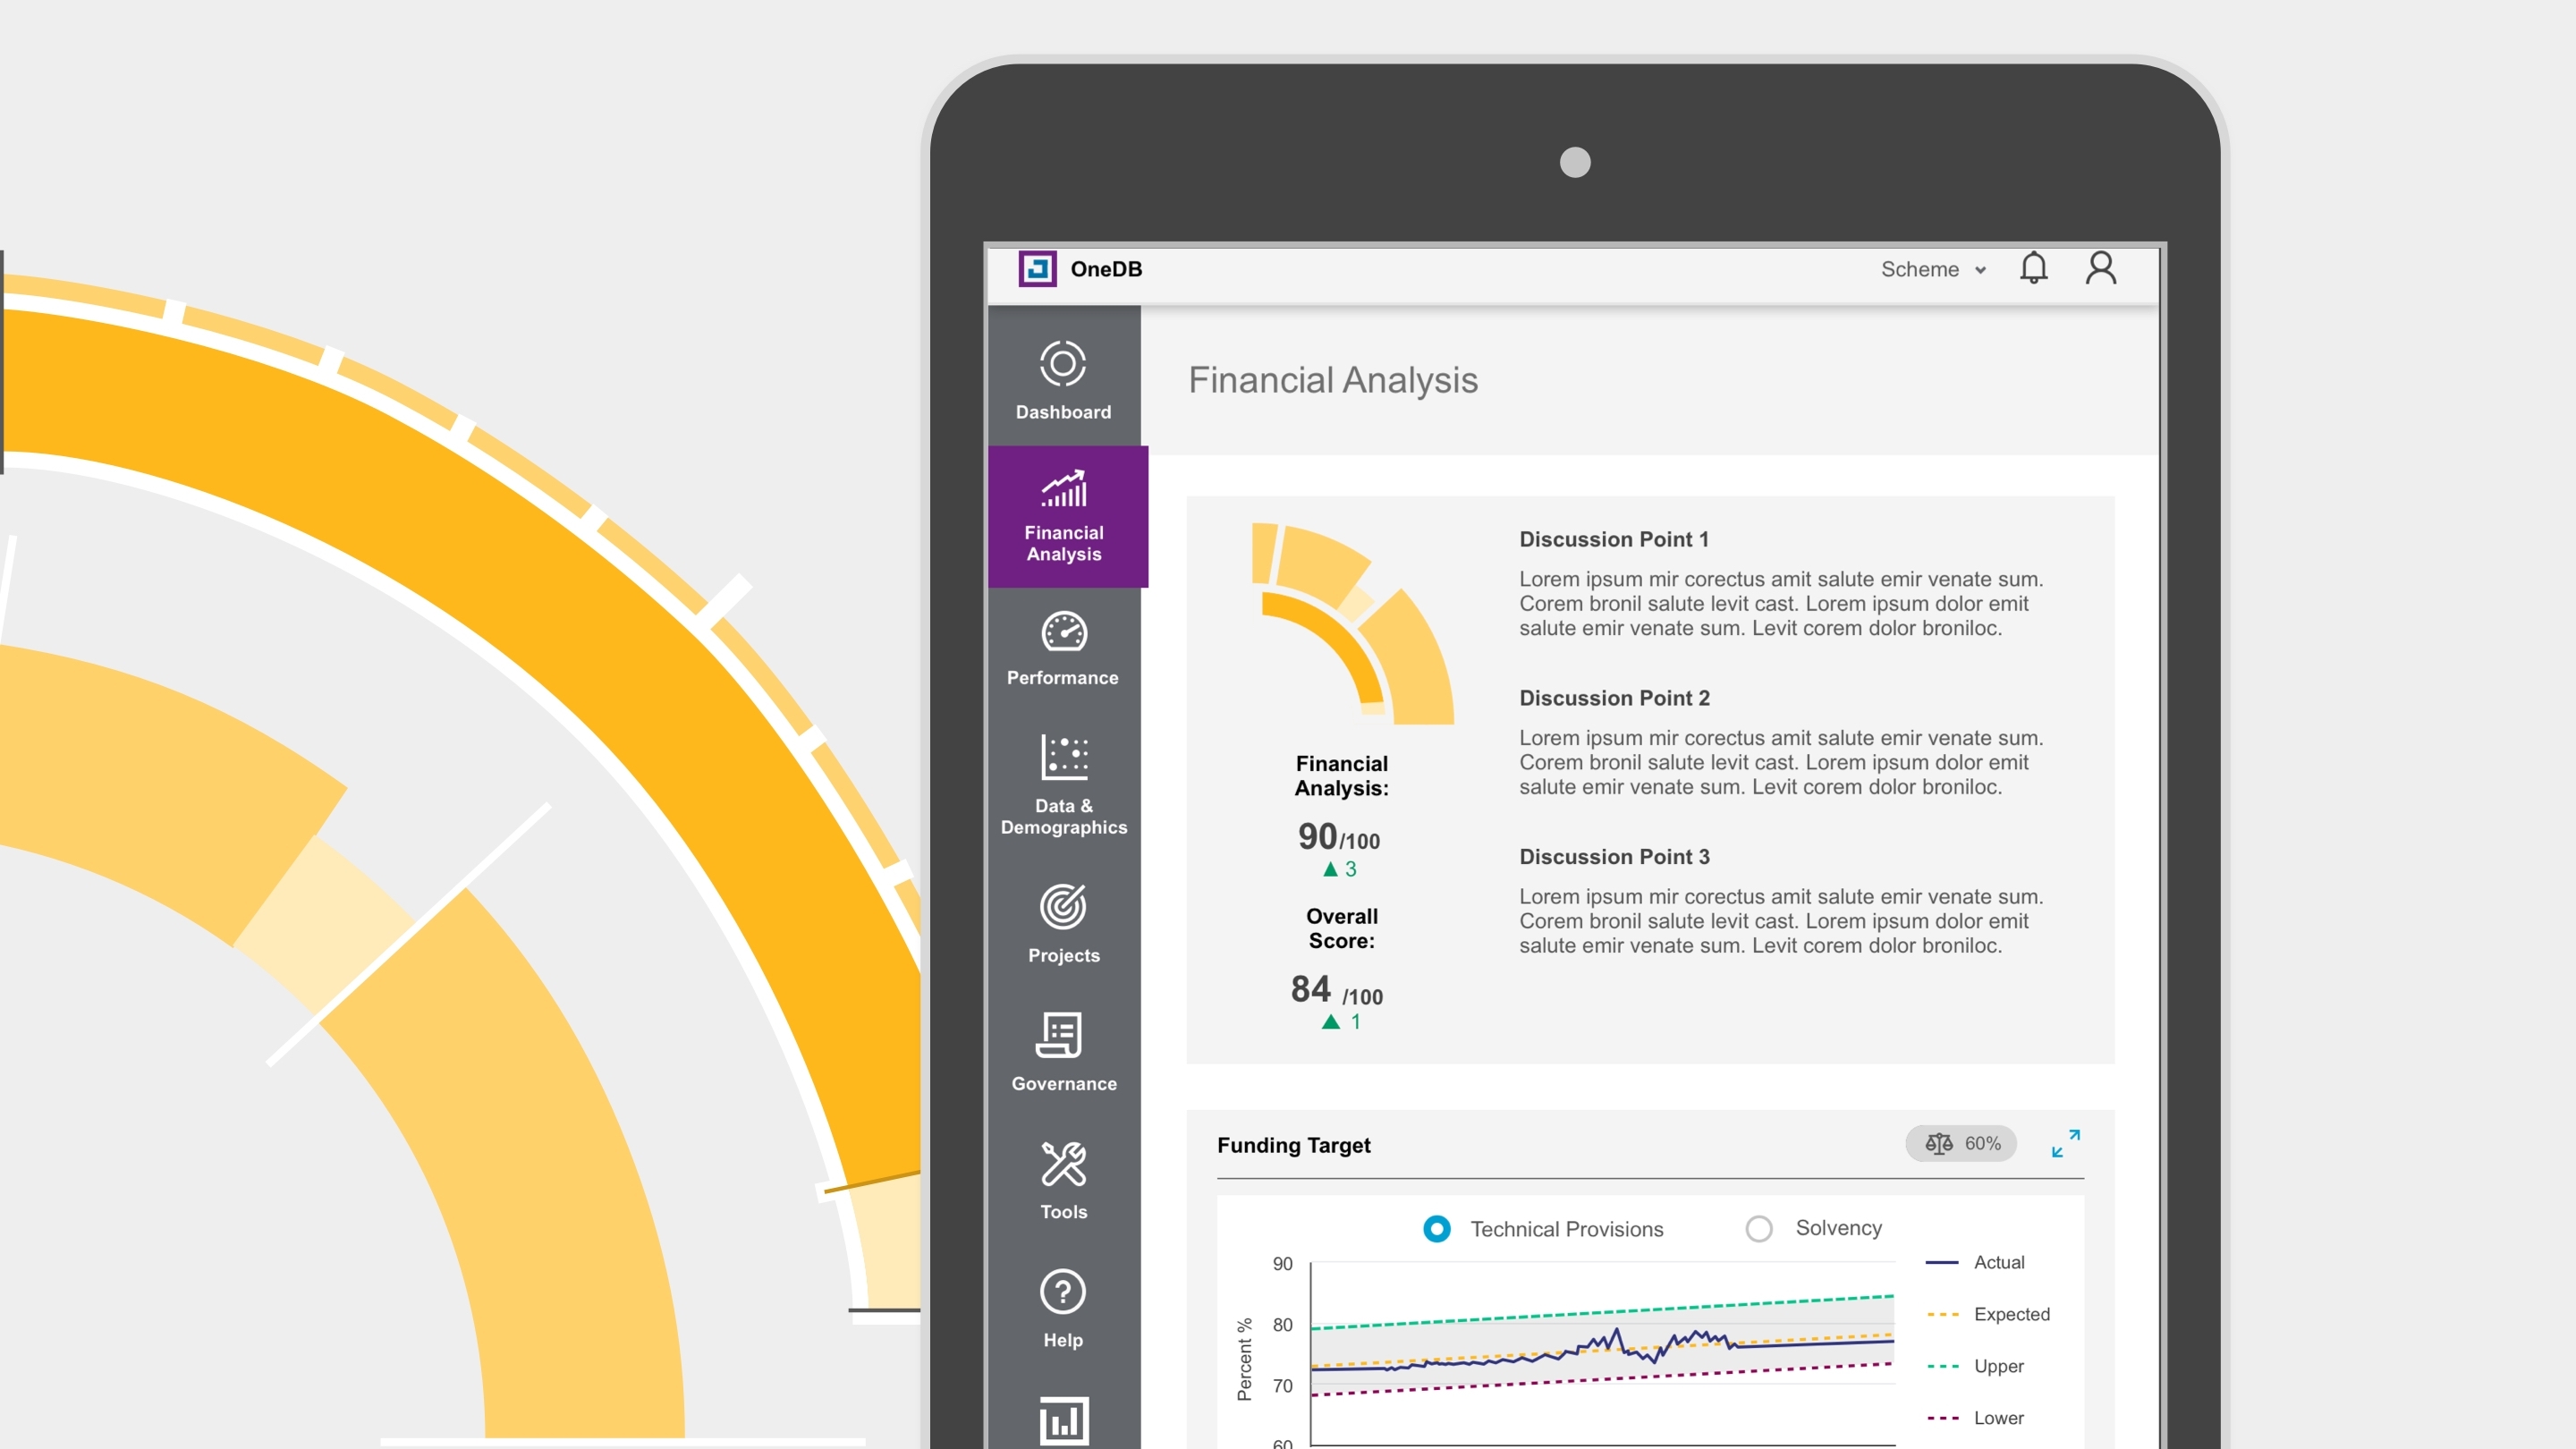
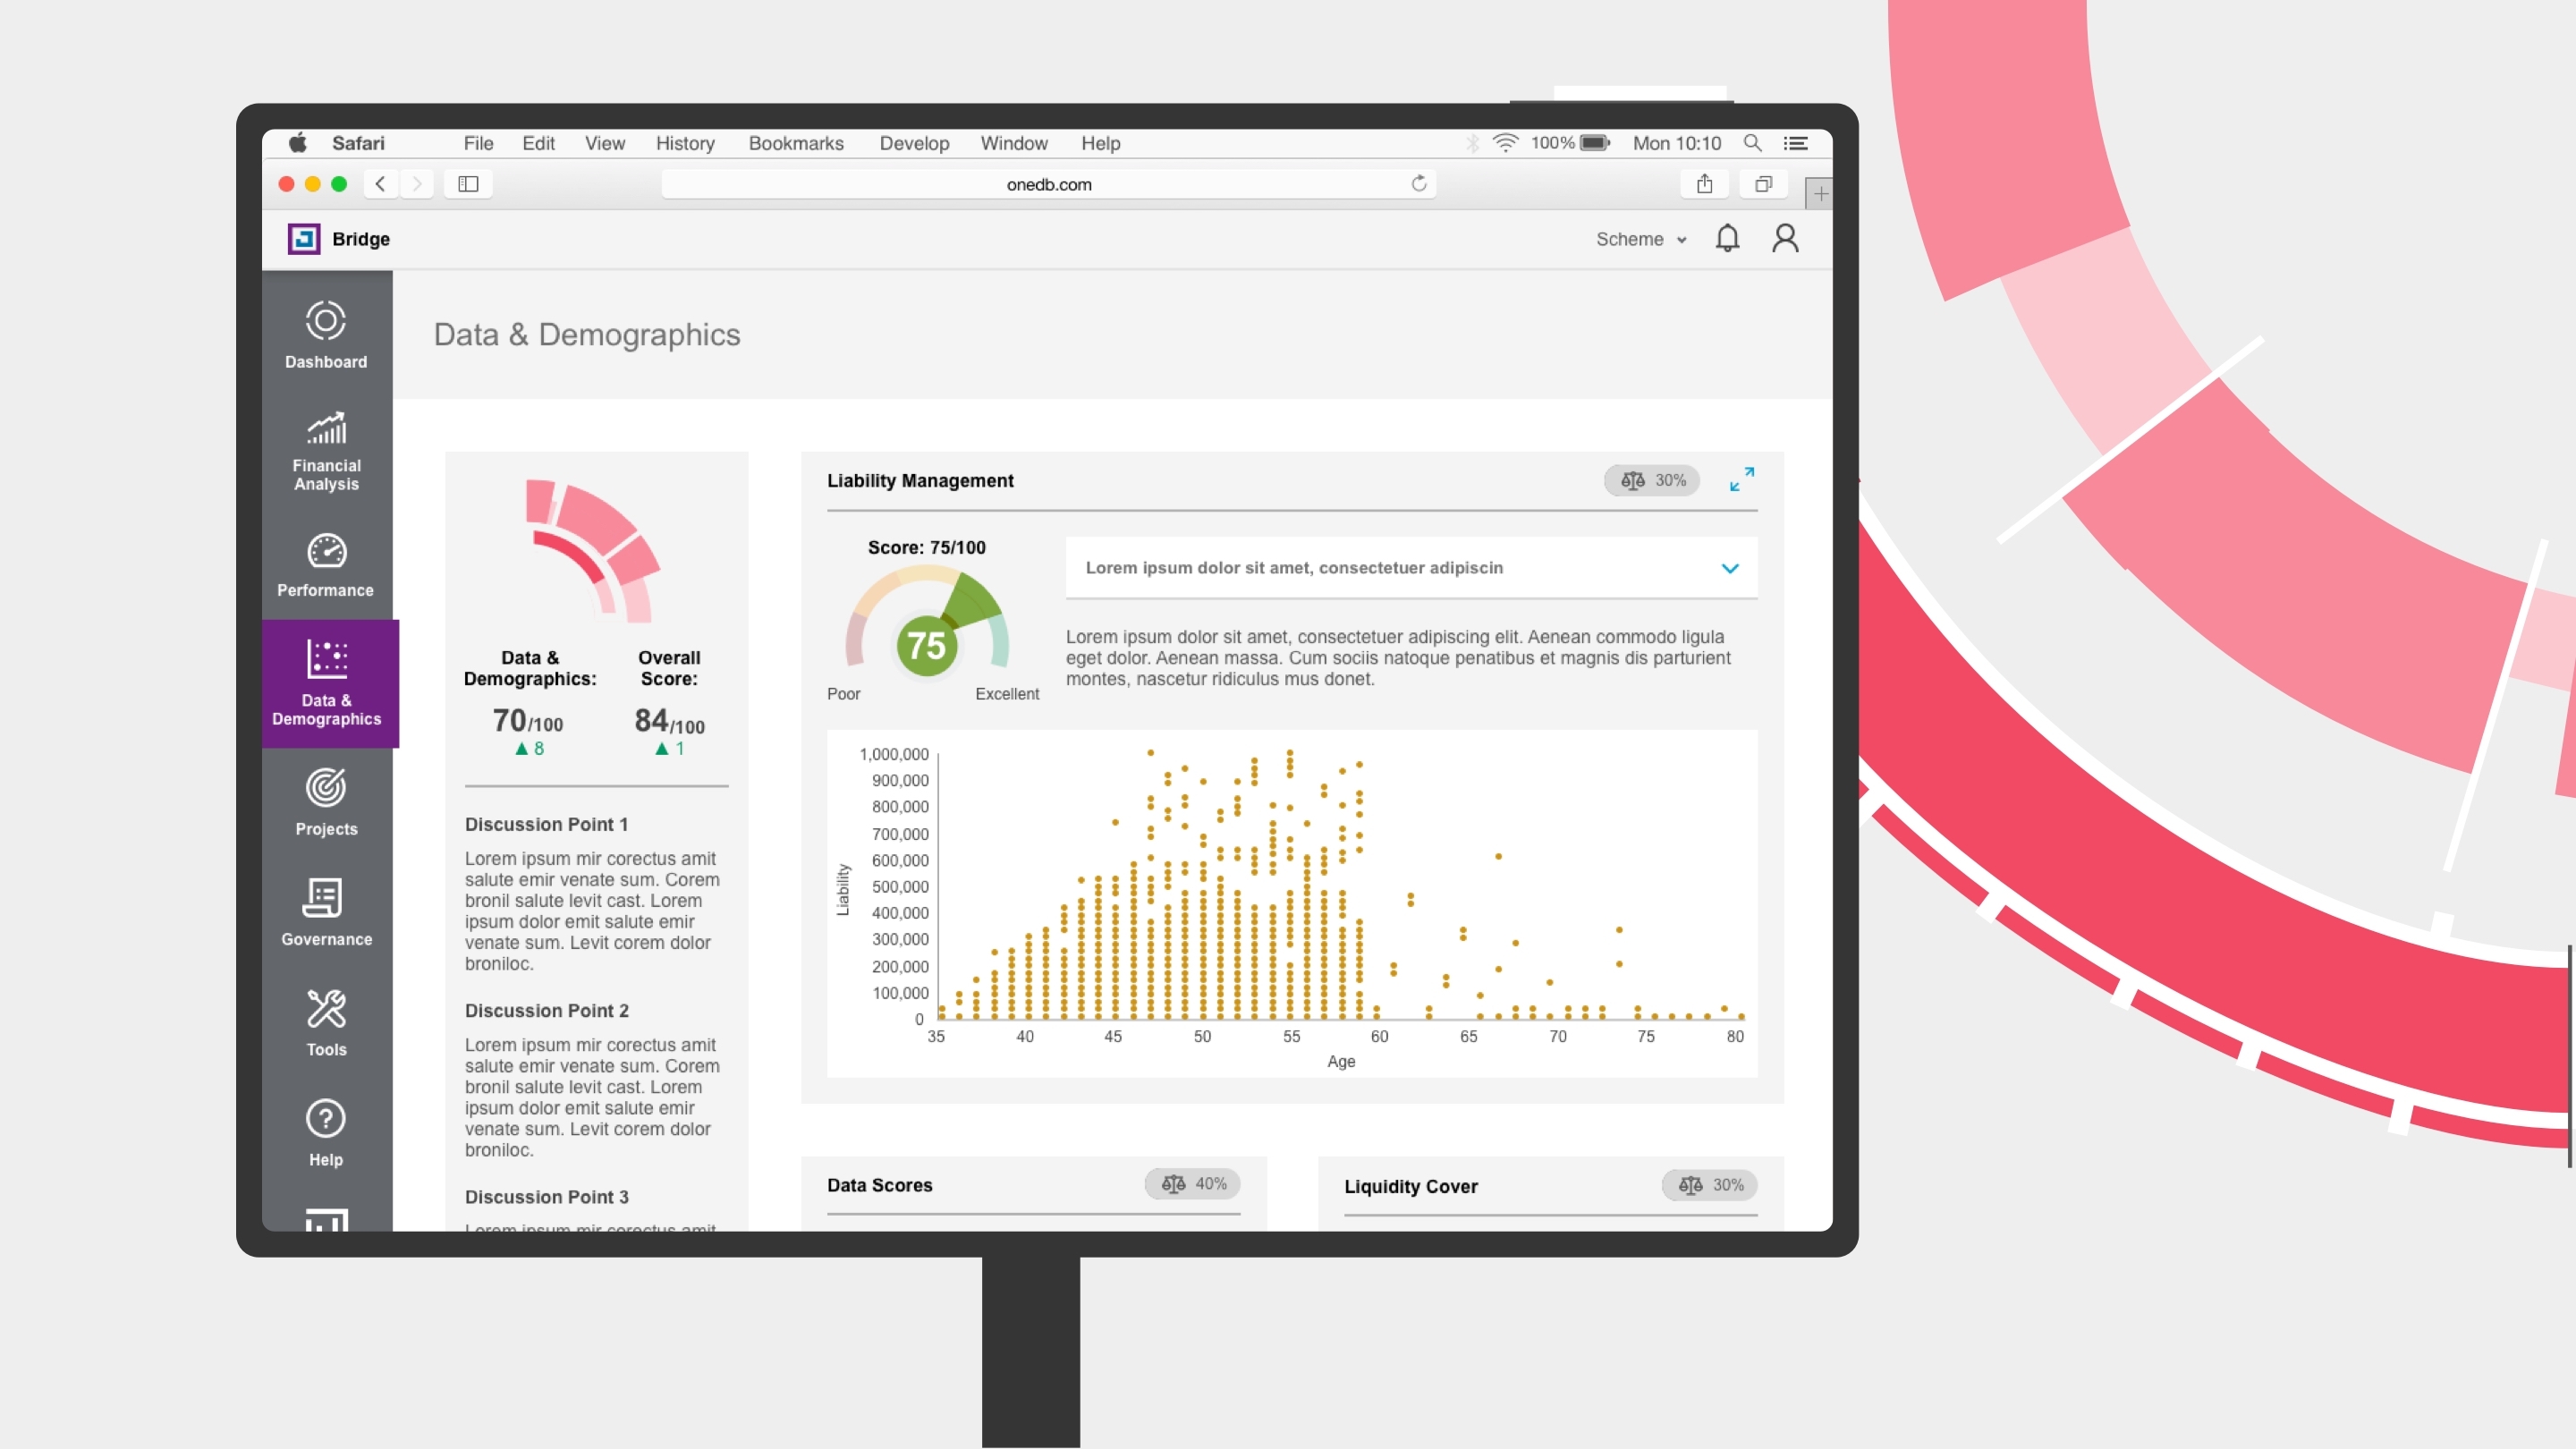
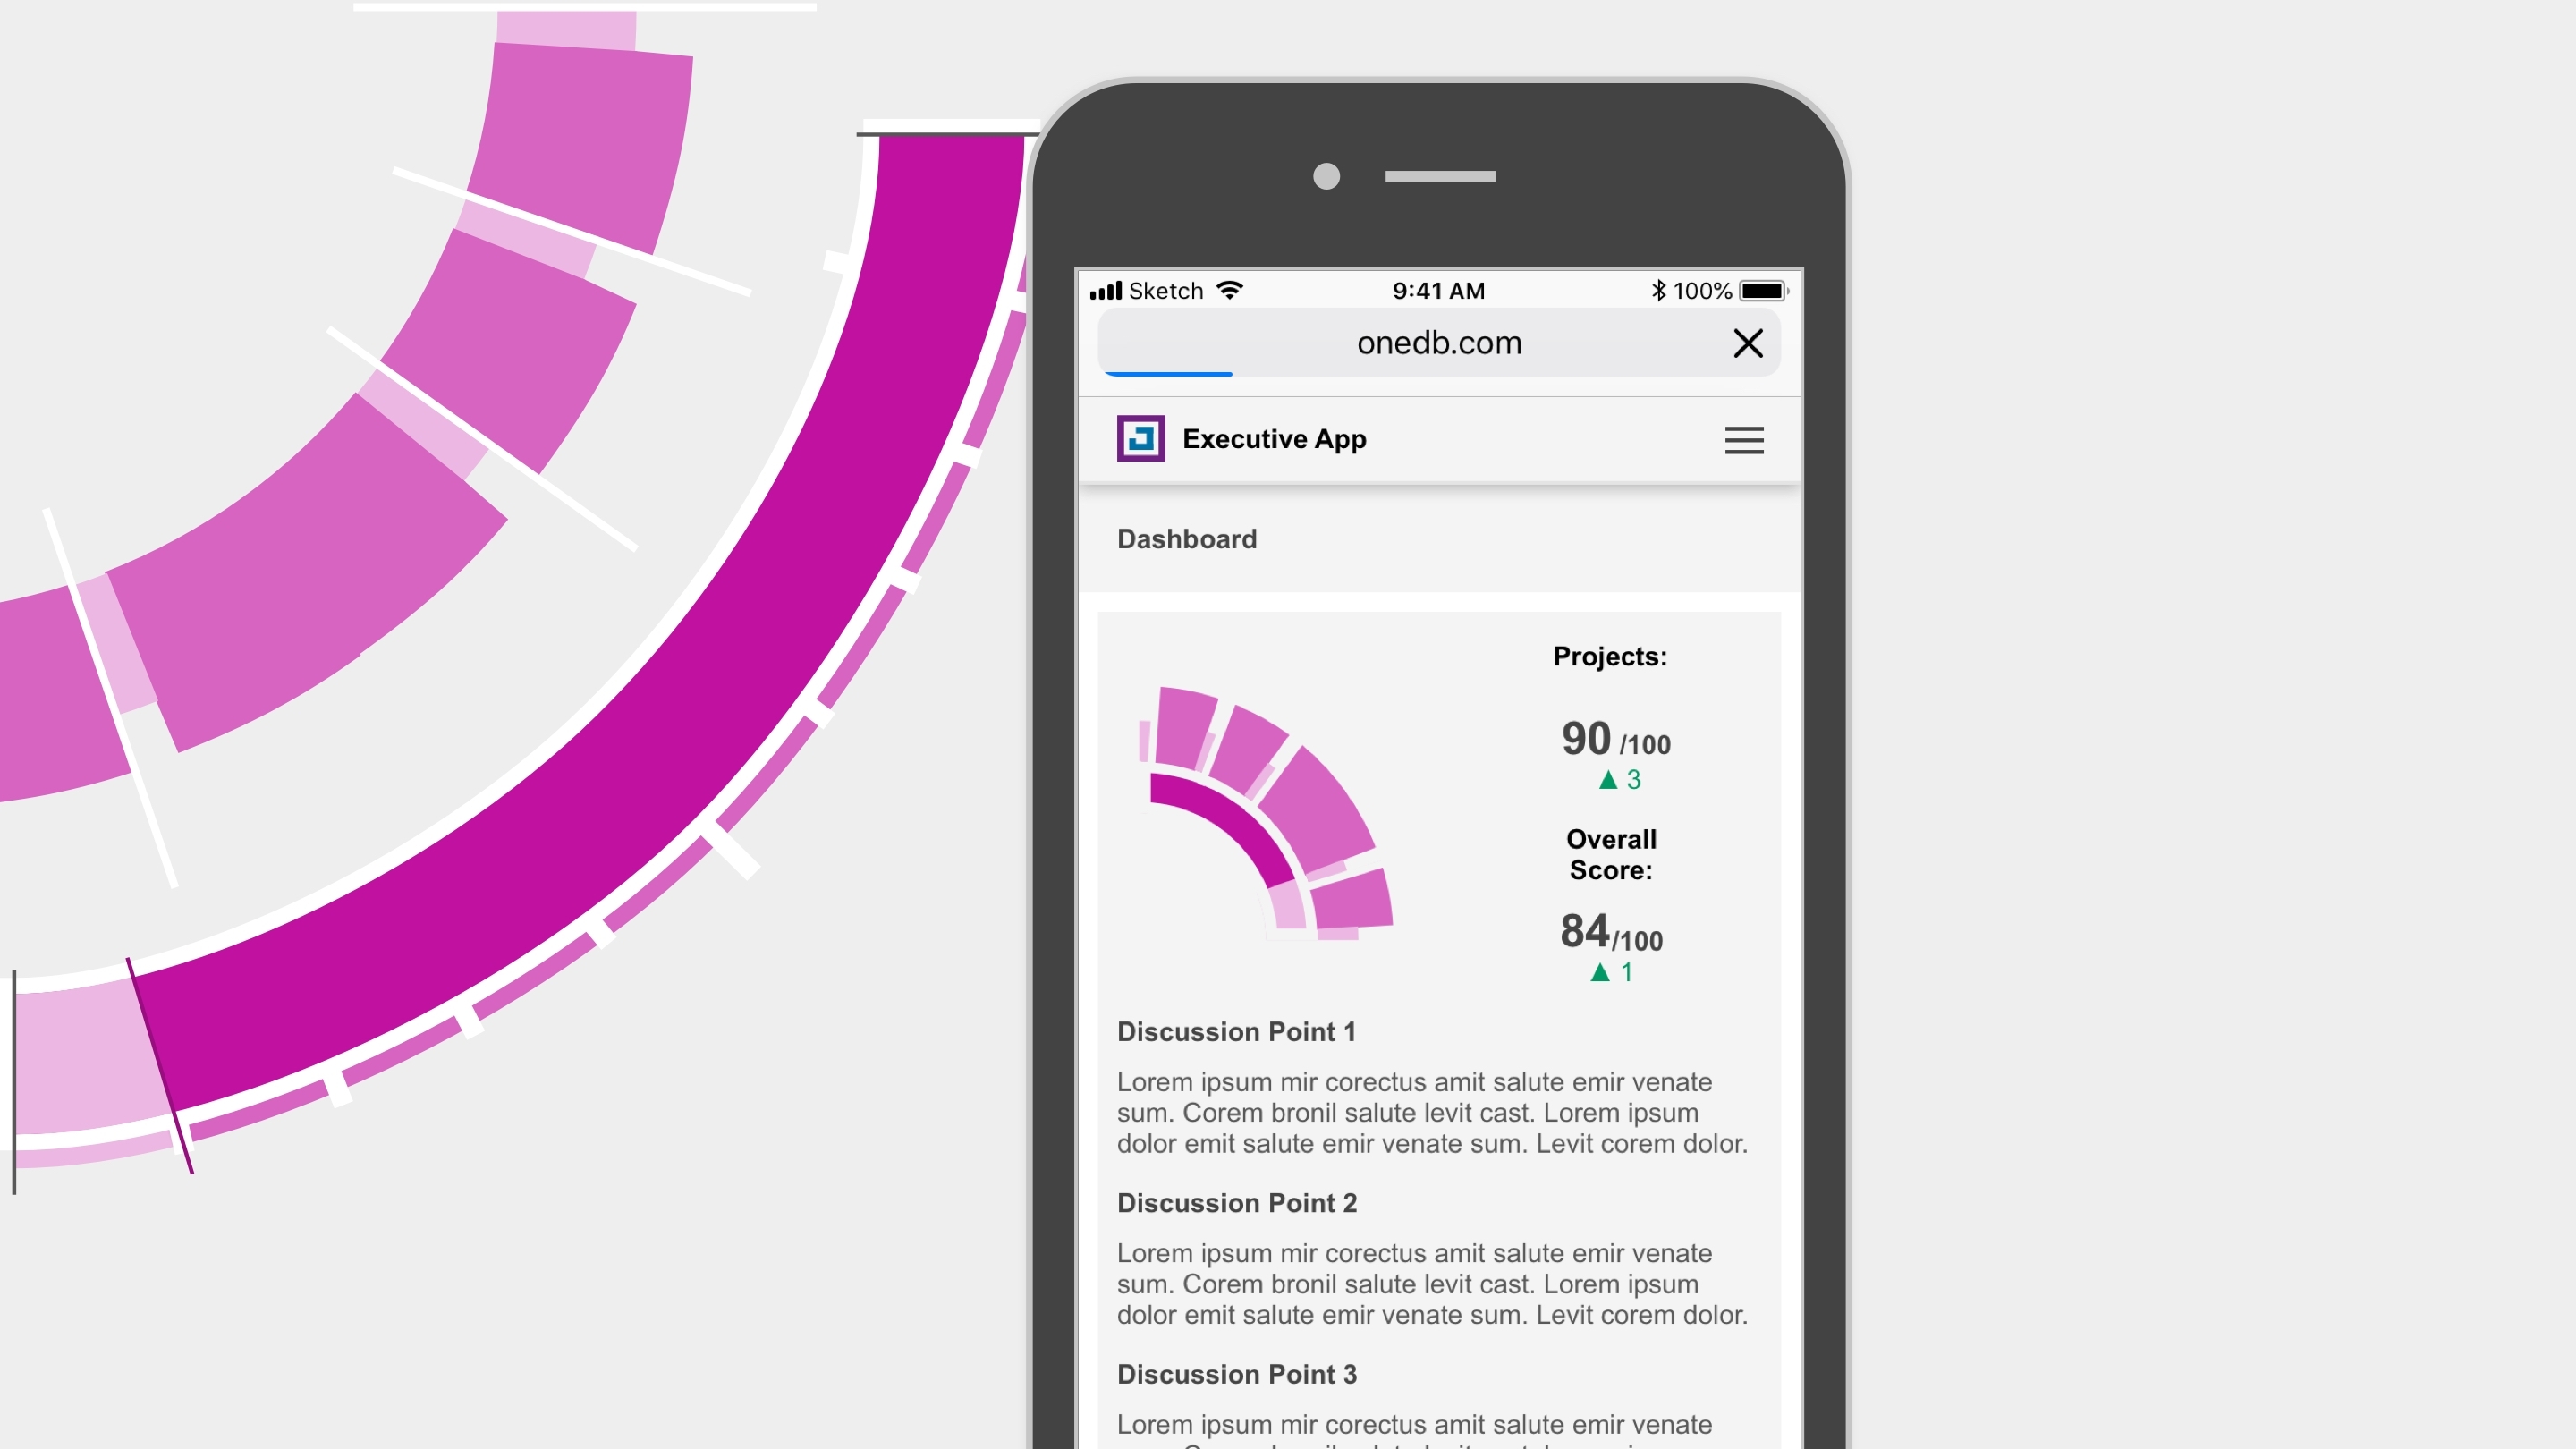
The resulting product has a great presentation element with all the information in one place, providing an overarching view in percentages and figures. Each section moves seamlessly, showcasing panels and graphs that tell the client more information. Jotham and the team designed the dashboard in such a way that the data can be easily understood and presented by any client.
Bettering Communication with Collaborative Working
The whole process of designing this product was partly collaborative. Those assigned to the project spent one day a week at the Willis Towers Watson office, working with their team, and then one day a week was spent together at the Brightec office. Working in this way helped us to discuss ideas more freely, overcome challenges as they arose, and reduce the amount of back-and-forth over email that can often occur with projects of this size.
The Future of Data Visualisation in Business
Having worked with Willis Towers Watson for many years now, we are regularly in touch. The product is serving their team extremely well and they continue to maintain and update the product. However, technology is constantly changing and updating, so, we often check-in to discuss any improvements that could be made as things develop.
We are proud to continue working with Willis Towers Watson. They are a brilliant organisation to work with, very collaborative, and we enjoy the challenge of working with systems that force us to adapt our processes and try new things. We are excited for what the future holds as we discuss new ideas together.
Visualise Your Data Differently with Our Development Apps
At Brightec, we think technology should be easy to use for everyone, which is why we create intelligent apps made for the user.